Interactivity is the dominant subject we are
dealing with since years in order to unravel complex geographical
contents and to animate them for visitors of exhibitions and museums
by means of interactive terrain and city models.
Fernwasserversorgung Oberfranken
A recent project on behalf of a regional public
utility 'Fernwasserversorgung Oberfranken (FWO, water
supplier)' gave the opportunity to expand 'interactivity' to real
time visualization of water processing data.
Starting point was the utility's intention to
broaden the scope of information with respect to the public, its
clients. For this purpose part of the water treatment plant in
Rieblich near Kronach (Germany) had been refurbished and
complemented by an information center where the basic water
technical processes can be explained and where the geographical
extent of the utility's activities can be demonstrated to
visitors.
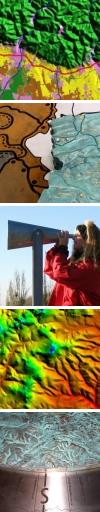
Interactive terrain
model
QUOMODO.de developed the component 'interactive
terrain model', an installation that gives an insight into the whole
production and supply chain within a reach of some 150 by 100 km.
The terrain model itself outlines this irregular supply area of the
utility.
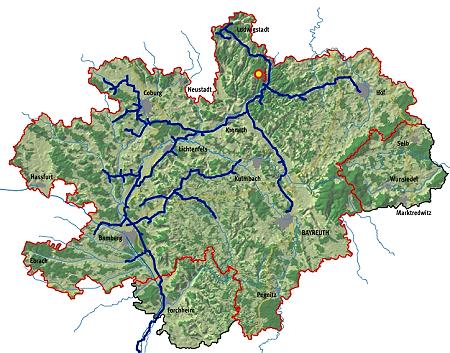
FWO supply area, network of
pipelines
The leading storyline of the presentation module
is of course to display the extensive infrastructure of the utility
made of pipelines, reservoirs, pumping stations and water treatment
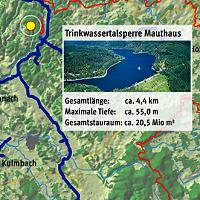
plants distributed over a large area. Furthermore it is demonstrated
where the raw water comes from, how the utility is processing this
natural resource to first class standards of drinking water and how
this is finally transported to the consumers.
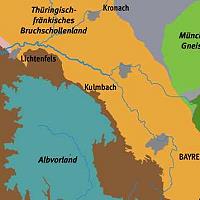
Location and type of technical
facilities / The geological
underground
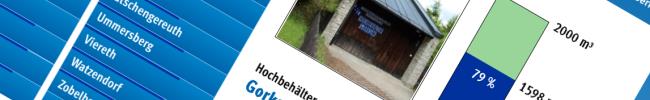
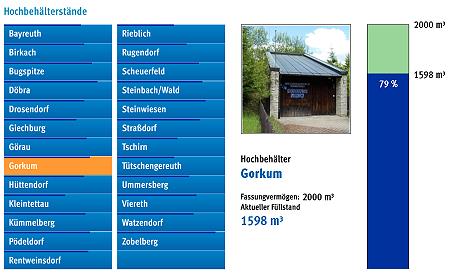
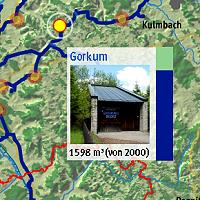
Visualization of
process data in real time
The location of the information center in the
very heart of the utility, the water treatment plant in Rieblich,
offered the opportunity to read and visualize processing data in
real time onto the interactive terrain model. For example data such
as the actual fill levels of reservoirs or the flow rates of
individual strands of the pipeline system can be studied.
Navigation screen on touch
terminal
Visualization on surface of
terrain model
Conclusion
Extended interactivity improves the value of
information with regard to animated terrain or city models and so
boosts the clarity within a given geographical context. Beside
incorporation of this type of processing data also other sources of
real time data have been part of interactive terrain models in other
project such as internet contents, life-webcams or readings of
weather stations.
The information center of the utility FWO in
Rieblich recently has been inaugurated and can be visited on
request. Find more information on the website of the utility itself
(German only). >>Link More information
on this QUOMODO project please find here.
Please consult also our website.
Under projects you'll find an overview of current
works.